Tag: Visualization
-
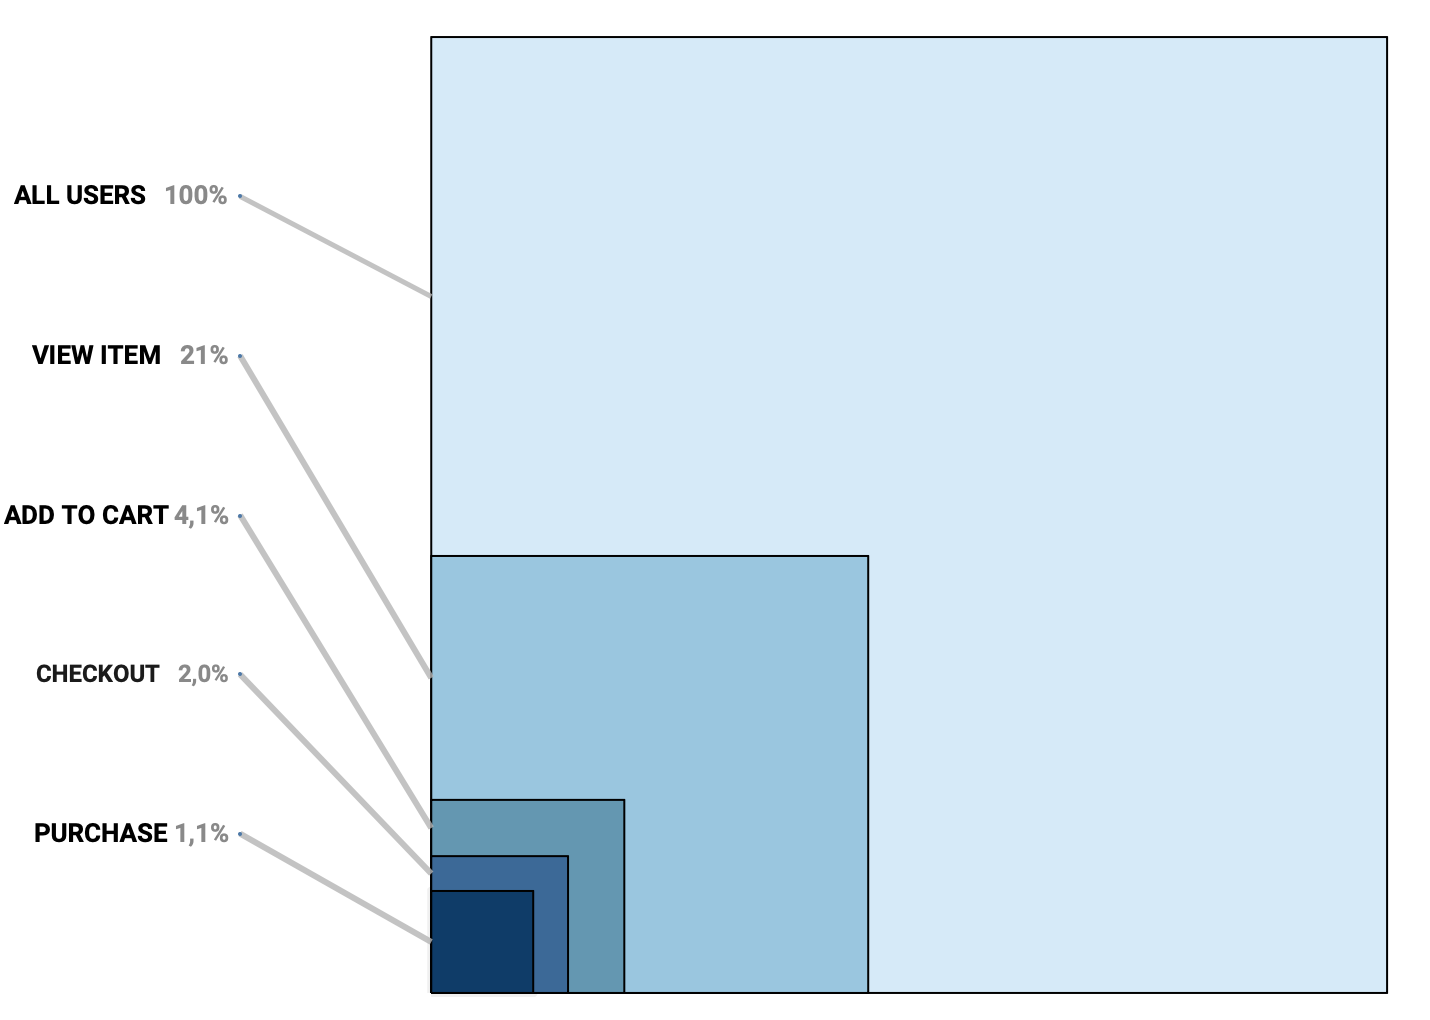
Area Funnel chart in Tableau: Visualizing the Drop-Off
In the world of digital analytics and customer journeys, not every user makes it to the finish line. Some browse a product, others add it to their cart, but only a fraction complete a purchase. Understanding where users drop off—and how many—can offer crucial insights for optimizing your process. That’s where funnel visualizations come in.…
Written by