
You can use to create your own Christmas Movie Marathon in Tableau using this dashboard!
Based on the IMDB dataset ‘100 best Christmas movies of all time’ and some nice Tableau techniques you can determine which movies you want to watch this holiday.
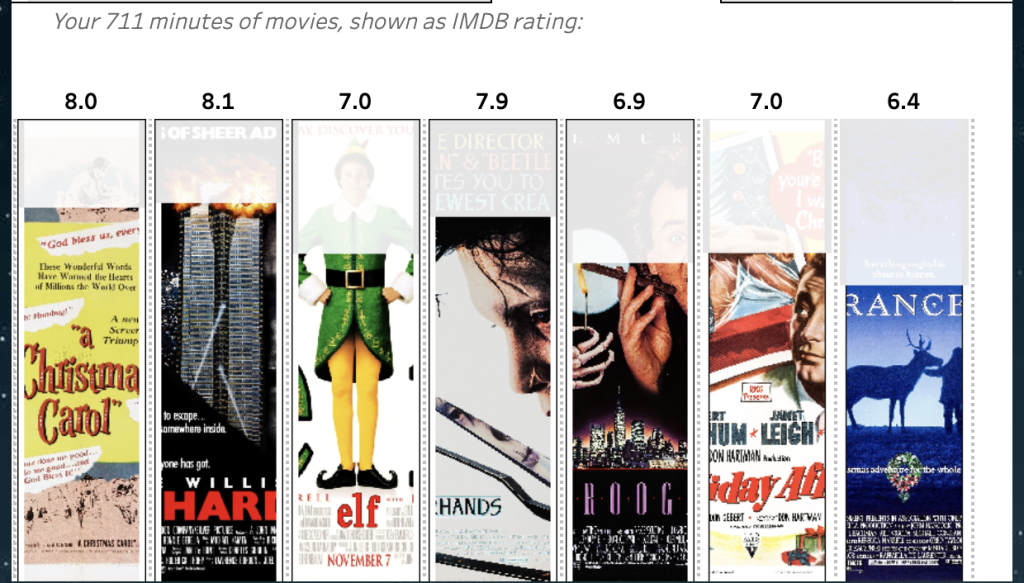
Start by entering the time you can spend on movies this holiday on Step 1 (from a couple of hours to several days), and then use step 2 to select all the movies you want to see during this time.
Selections can be made on plot, but also runtime, genre and/or IMDB rating.
The dashboard can be found on Tableau Public.

Data: IMDB download and Python API
The website of IMDB contains many lists of movies, including one called ‘The Top 100 Christmas movies of all time’. They started it 13 years ago, but the list keeps updated.
I already started to copy/paste the data into an text-file, when I found out you can easily export the data using the export button…
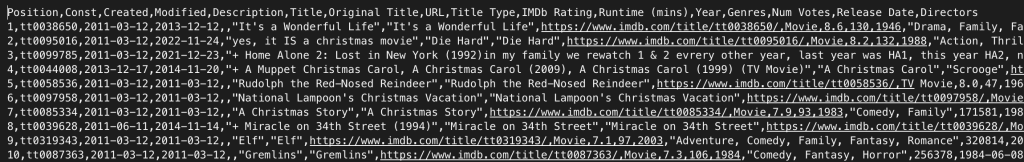
This dataset is already detailed, but I also wanted the images of the movie posters (just like the Data + Movies dataset…). Using Python and the Cinemagoer package it wasn’t that hard to get this data.
Images as bar chart using realtime processing
Many advanced Tableau techniques are used within this dashboard, like recursive parameters, combined URL/parameter actions and especially: image roles.
The main challenge in this dashboard is the use of images as the bars of a bar-chart. This is done using the Tableau image roles – in an alternative way than it was probably intended initially.
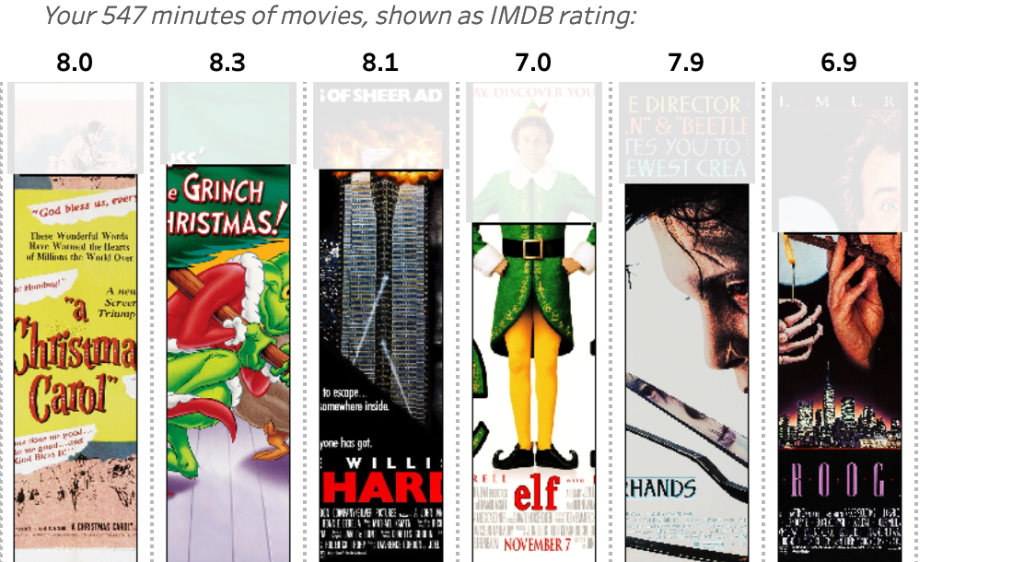
Image Roles
Image roles in Tableau work with URLs: the images are fetched from an external webserver and shown in a header. Ideal for product photos, category icons, and of course movie covers, because you don’t need to import these into Tableau (like shapes), and can be added programmatically (unlike images or Web Page container).
Dynamic Image Roles
But using them as a bar chart requires a special approach. If I want to show the runtime of a movie as a bar, I need to change the image on the web-server to the right size. I don’t want to create hundreds of images for each movie in advance, but generate the ‘bars’ real-time when the dashboard is viewed.
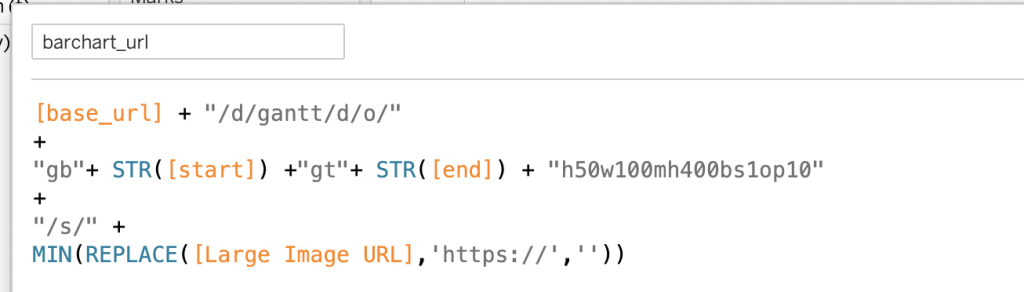
Using PHP – a programming language I know rather well – and the configuration of the Nginx webserver a special formatted URL in Tableau is getting ‘translated’ to the right image (but this can be done in . First the external script fetched the image from IMDB, and optimizes it for size and re-use. Tableau ‘instructs’ the script via the URL to change the image based on a string like gb0gt79h50w100mh400bs1op10
- start at 0% (gb)
- end at 79% (gt)
- width 100px (w)
- maximum heiight 400px (mh)
- border size 1px (bs)
- opacity of the remaining space (op)
This ‘option’ string can easily be extended to other options, as long as I process these in my script
An important consideration is caching: when a dashboard is heavily used, you want to minimize the script’s processing load. Implementing caching during data fetching, manipulation, and on the server side can help keep the web server running smoothly.
Formatting
At first I created a ‘real’ bar chart with no fill on top of the bar – but after some experimentation it seems fun to add the remainder of the image as a less opaque version of the part – just because it”s possible:


Gantt bar
An extension of the bar-chart is the gantt-chart, which shows a schedule – in this case your movie marathon:
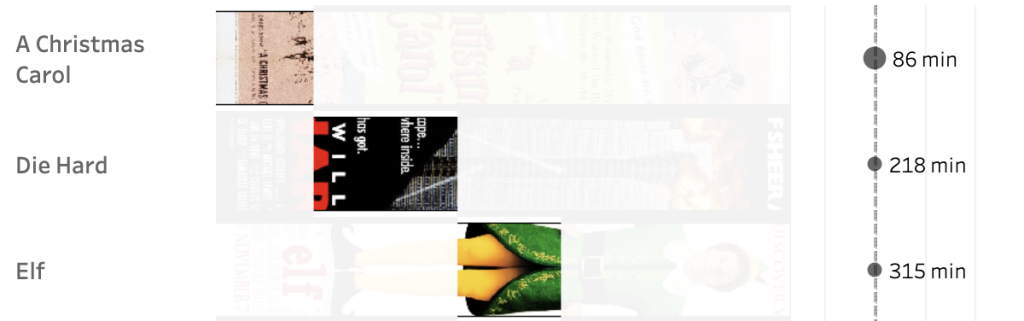
The script is exactly the same as I used for the bar-chart. The initial script was adapted to make rotation possible, and to select a ‘top’ and ‘bottom’ which needed to be removed in order to create the gantt-chart.
More Image Role fun – and challenges
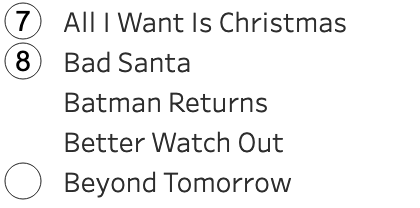
The image role is also used for the movie icons on the left of the dashboard, even the ’empty’ part is an empty image. Changing the URL based on parameter and calculations (order of selection, time left, …) makes this list easier to use.
If you are going to use image roles in your dashboard (and you should!) make sure you don’t use too many different images (max 200), and keep them small. If the number of images gets too large, and/or the size of images too big, the images are not shown at all… When using photos (like products, or movie covers), resize and compress the files as small as possible while still looking good. SVG files are ideal for icons: these are small in size, and scale very well.
A small but annoying ‘feature’ of image roles is the fact that the image url is shown when you hover over them. I hope this feature will be removed very soon, since I don’t see any use case for it.
Developing using many image roles in Tableau Desktop is challenging, to say the least. The build-in browser of Desktop is not very capable of doing complicated rendering, so you get an interface like this to work with:
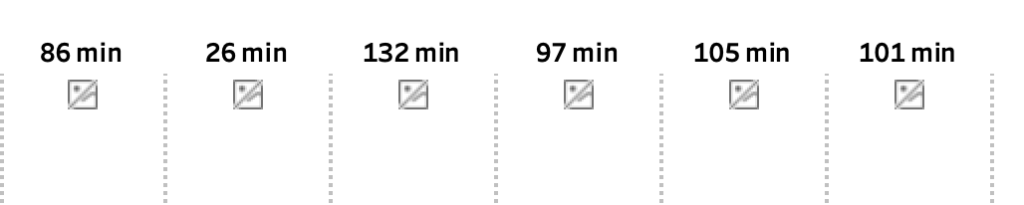
Therefor you need to publish the dashboard again and again to see if everything works the way you want to.
A very nice habit of these image roles is the fact that they work on Tableau Public – unlike extensions. Unlike extensions there are no possible security risk involved with image roles.
Other implementations, more ideas, questions?
If you have questions regarding this dashboard, and especially on using the image roles, please let me know at johan@antichaos.net!
I can also help with your own implementation of image-based bar charts.
Leave a Reply