Category: Tableau Hacks
-
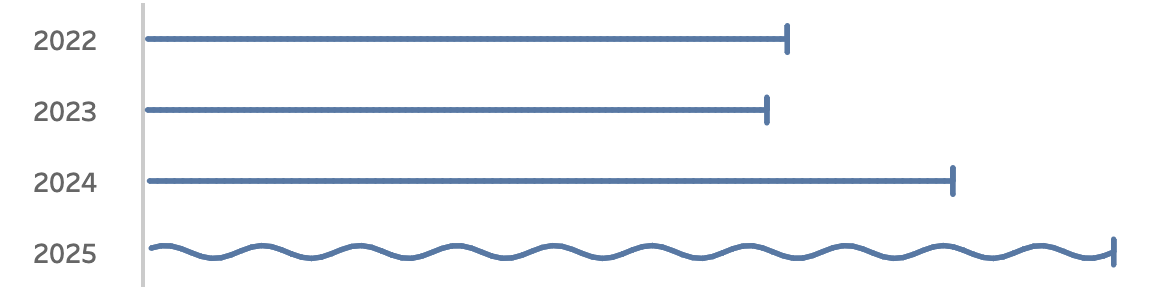
Visualizing ‘Dynamic’ Data using a Sine Wave
Recently I ran into a small but surprisingly tricky problem: how do you visualize something that’s in progress? A standard bar chart works usually perfectly for completed values, but what about the final bar isn’t finished yet because e.g. the year isn’t finished yet, Fading it out, changing the shape or adding a label like…
Written by
-
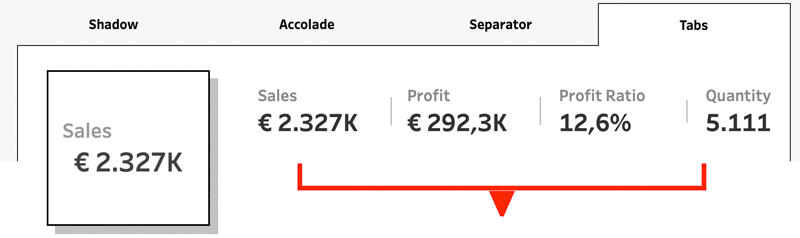
Tableau Container Art – 4 examples of formatting dashboards without images
Tableau containers don’t exactly have the best reputation. Most people either ignore them or wrestle with them. But once you actually get along with containers (and their friends: borders, background colors, and padding), they turn into your dashboard’s interior designers. In this post, I’ll show you four small but powerful ways to use the Tableau…
Written by
-
Abbreviate long text in Tableau
When working with text data in Tableau, you’ll often need to clean or reshape strings to better fit your analysis or visual presentation. Abbreviating text is a common challenge when designing dashboards, reports, or any interface where space is limited. Whether you’re working with long product names, category labels, or freeform text fields, overly long…
Written by

-
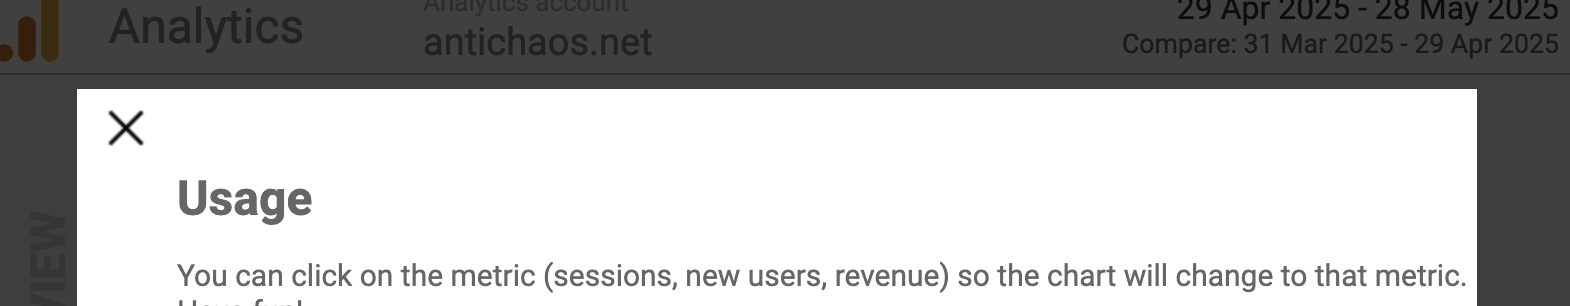
Show/Hide – but better
The default Show/Hide button in Tableau offers a quick way to toggle dashboard elements, but it comes with limitations—especially when dealing with larger components like full-screen visualizations or help panels that can obscure the toggle itself. In this guide, I show a smarter approach using Dynamic Zone Visibility and Parameter Actions. By setting up separate…
Written by
-
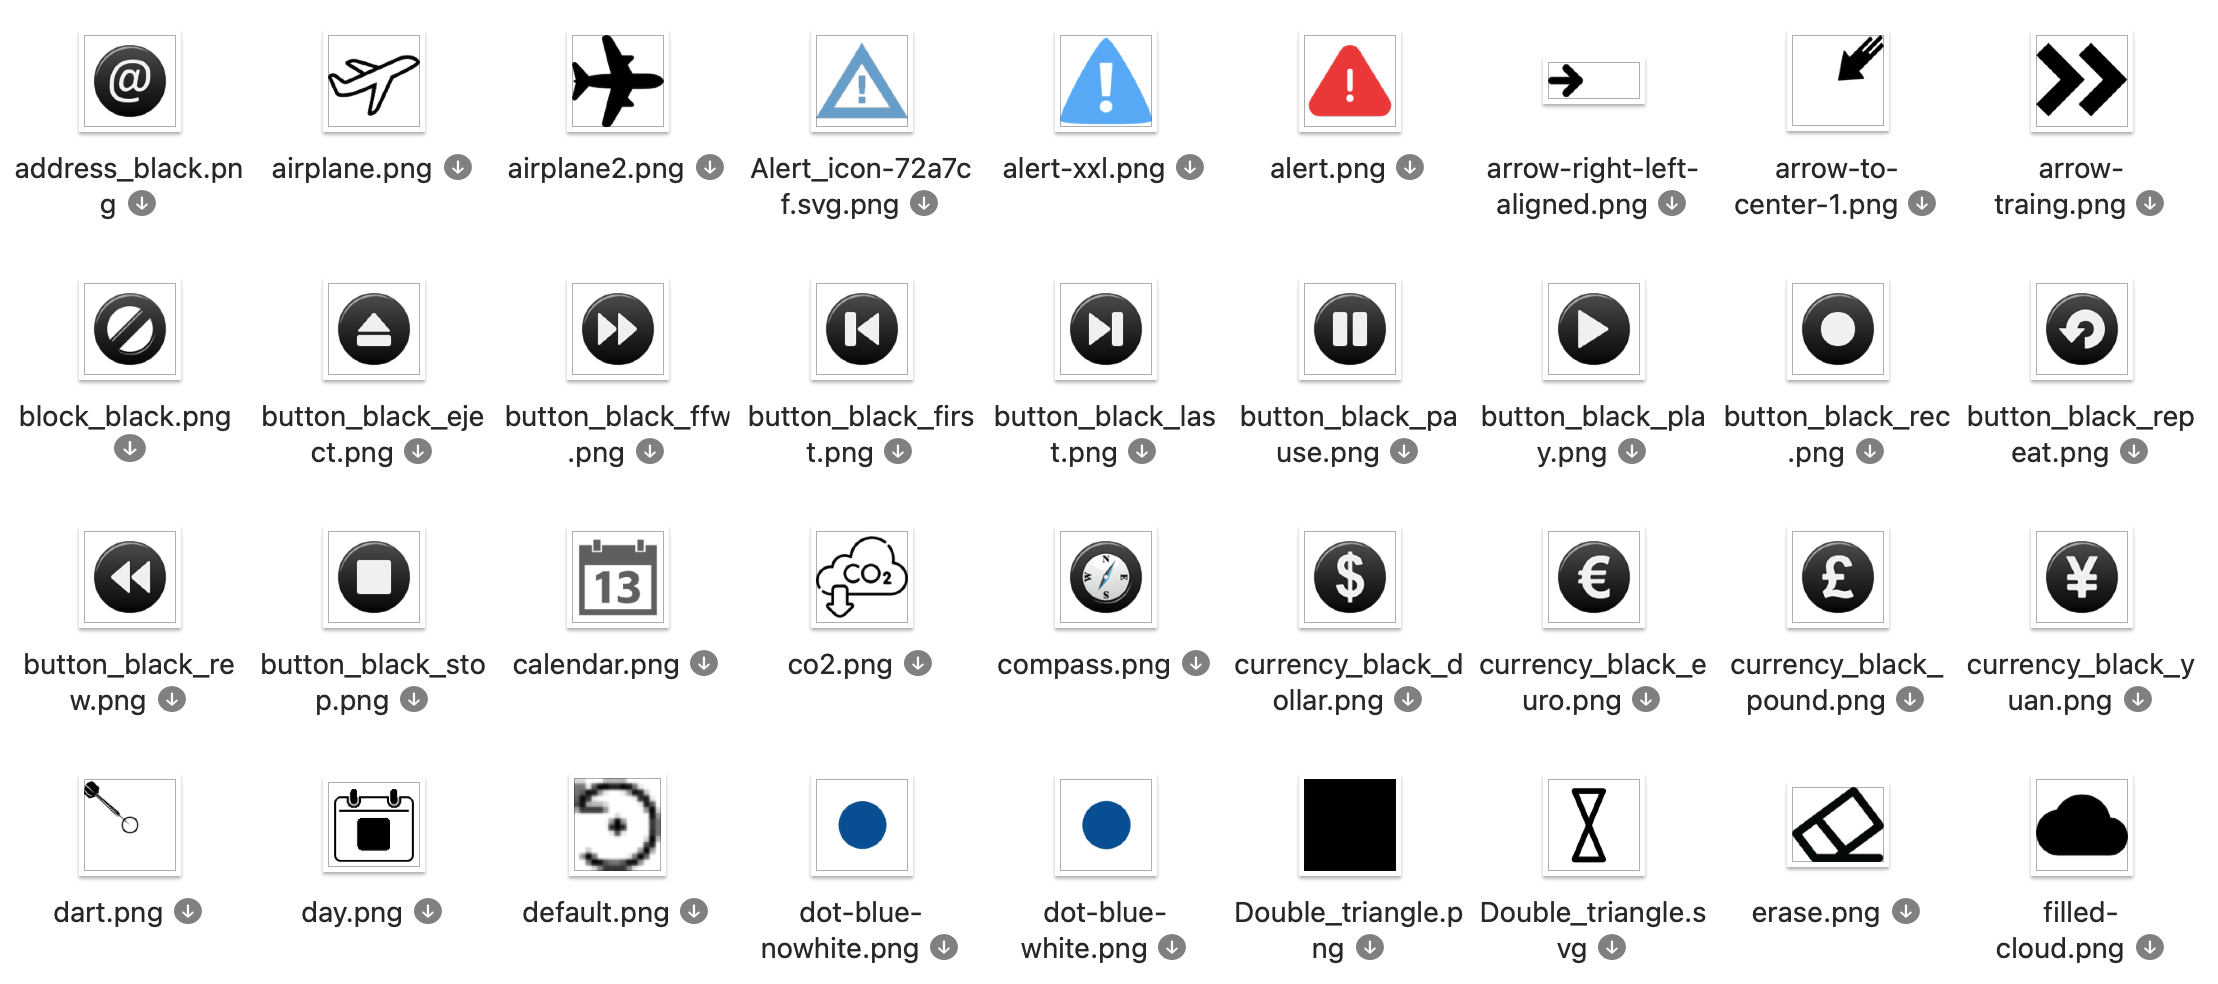
Extract custom shapes from Tableau workbook
Ever got a Tableau workbook with shapes you want to re-use, but weren’t able to because you didn’t have the original files? You can extract the files from the workbook! Either by hand opening the source code, or using my small Python script.
Written by