Category: Tableau
-
Better datefilters in Tableau
Datefilters are one of the most common filters on any dashboard. They are needed to see trends, make decisions on the right period, and analyse within the right context. But most of the times these filters are not optimal – so let’s make them better (and prettier)
Written by

-
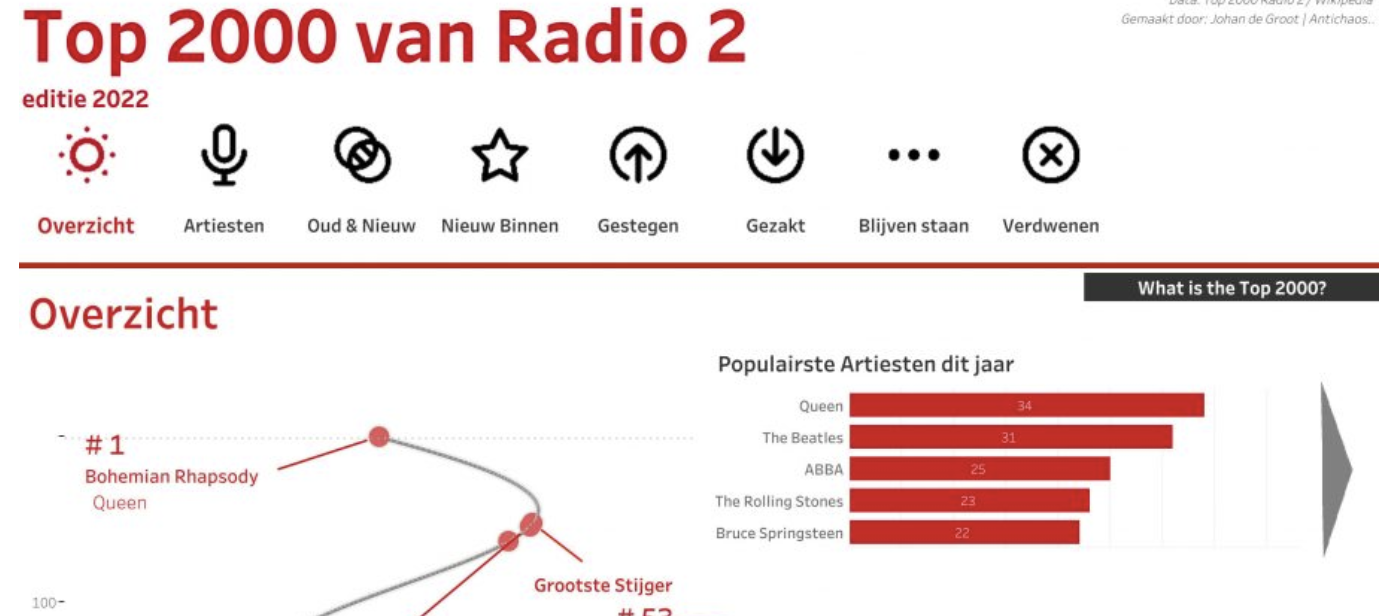
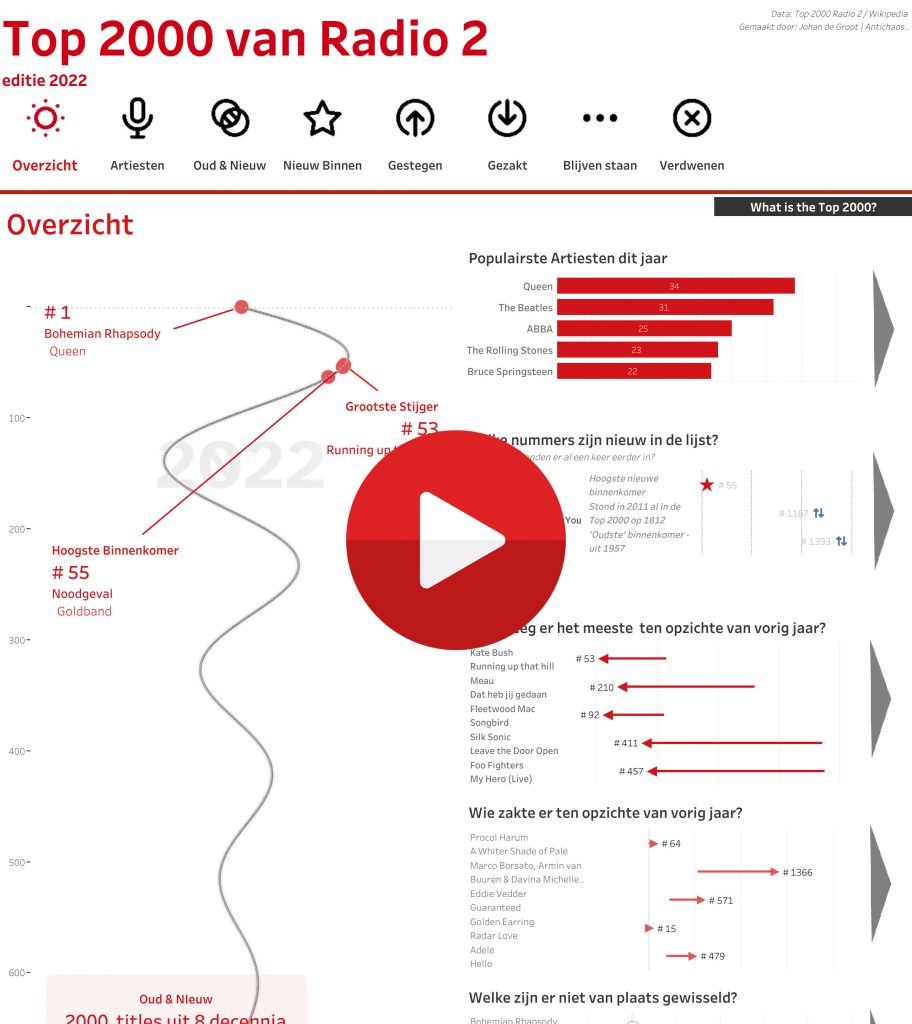
De Top 2000 van 2022 gevisualiseerd
De Top 2000 zoals uitgezonden door Radio 2 heb ik gevisualiseerd met behulp van Tableau. Dit jaar wat minder nadruk op een de vorm (hoewel ik heb gekozen voor een gedempte sinus, wat niet bepaald een veelgebruikte manier van weergeven is…).
Written by
-
Featured Forum Ambassador
Tableau has created a nice blog post on Tableau Forum Ambassadors. It describes what these ambassadors do, how they can be used on the Tableau journey,
Written by

-
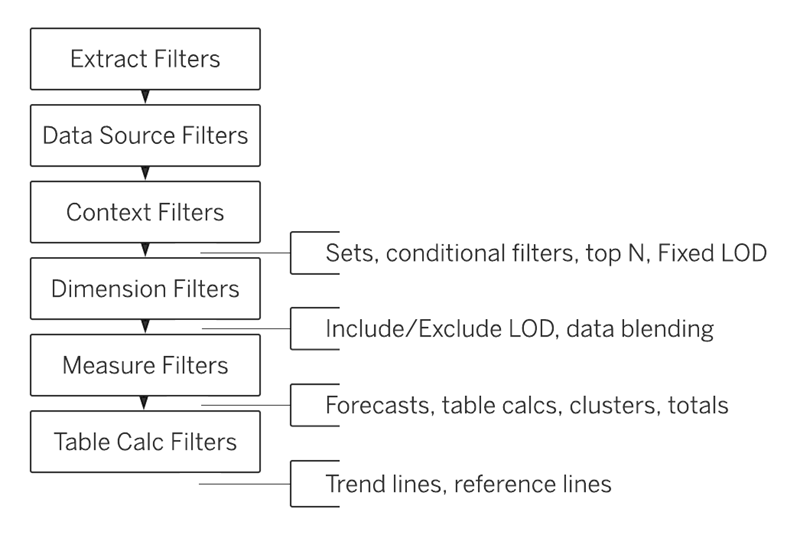
Tableau’s Order of Operations
The order of operations in Tableau refers to the sequence in which the software processes the data and calculations in a given worksheet or visualization. The order of operations in Tableau is the order in which Tableau performs its various actions. An action is mostly identified as a filter, but can also be a calculation…
Written by
-
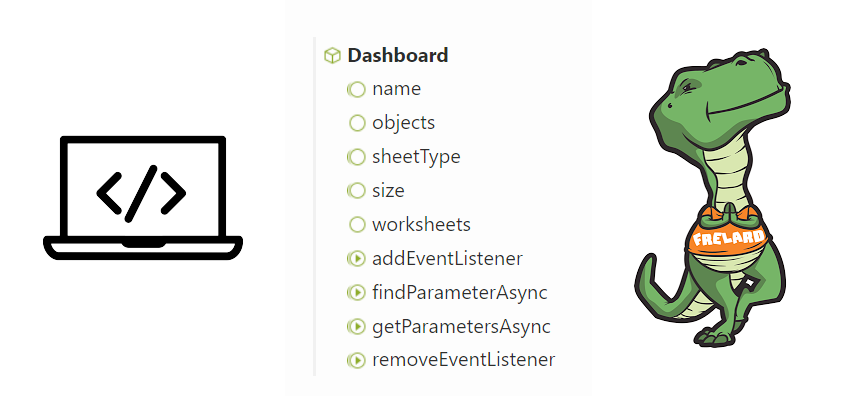
Write your own Tableau Extension for your current dashboard
Tableau Extensions are a way to extend the functionality of a dashboard to your own specific needs. Most people using extensions simply grab one of the many offered via the Tableau Exchange (free or paid). In this post I would like to encourage you to think about another option: creating your own extension! Sometimes you…
Written by
-
Write your own Tableau Extension for your current dashboard
Tableau Extensions are a way to extend the functionality of a dashboard to your own specific needs. Most people using extensions simply grab one of the many offered via the Tableau Exchange (free or paid). In this post I would like to encourage you to think about another option: creating your own extension!
Written by

-
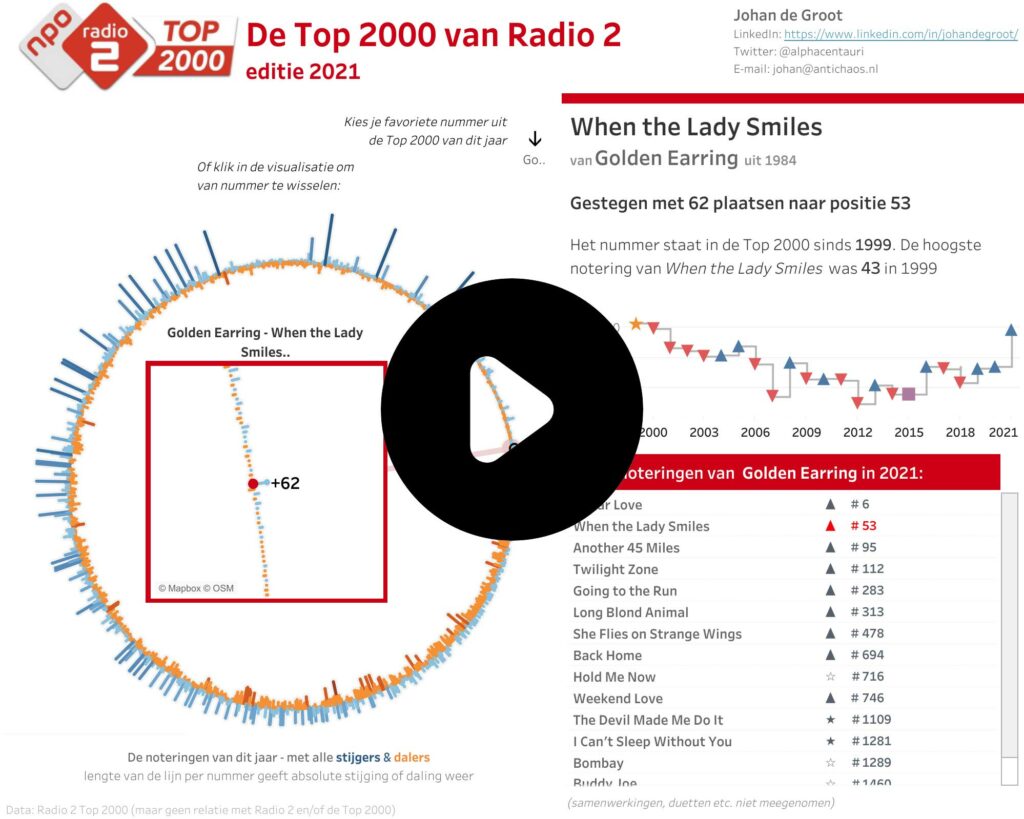
Top 2000 of Radio 2 – Edition 2021
It’s that time of year again… – the Visualisation of the Top 2000 of Radio 2! One of my traditions is to visualize the Top 2000 as being broadcasting by the Dutch radio station Radio 2 using Tableau. This time I choose a circular visualisation of the list, with a detailed/zoomed-in look at the chose…
Written by
-
Top 2000 van Radio 2 – Editie 2021
Het is weer die tijd van het jaar – de Visualisatie van de Top 2000 van Radio 2… De Top 2000 zoals uitgezonden door Radio 2 heb ik voor de 10e keer (geloof ik) op een andere manier gevisualiseerd met behulp van Tableau. Dit keer is er gekozen voor een circulaire weergave van de lijst…
Written by
-
Tableau Ambassador 2021
Honored and proud to be selected a 2021 Tableau Ambassador! Looking forward to work, learn and share ‘all things Tableau’ with even more people. Thanks Tableau, and congratulations to all new and returning Tableau Ambassadors. More information on all Tableau Ambassadors 2021 can be found here: https://www.tableau.com/about/blog/2021/9/congratulations-and-welcome-2021-tableau-ambassadors
Written by