Category: Featured
-
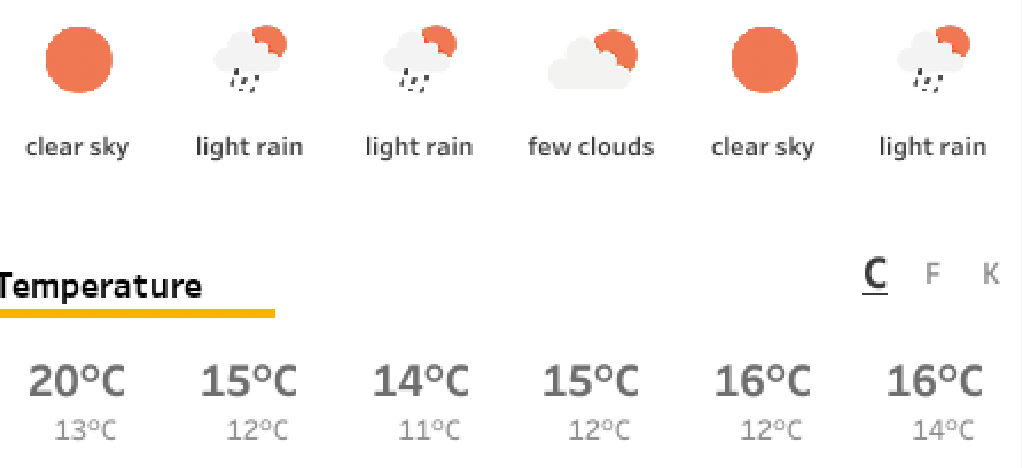
Weather Forecast dashboard in Tableau
It’s just a couple of weeks before TC24 in San Diego… So we want to know what the weather is out there! Or at home. Or any other place in the world. What better than building your own weather forecast in Tableau!?
Written by
-
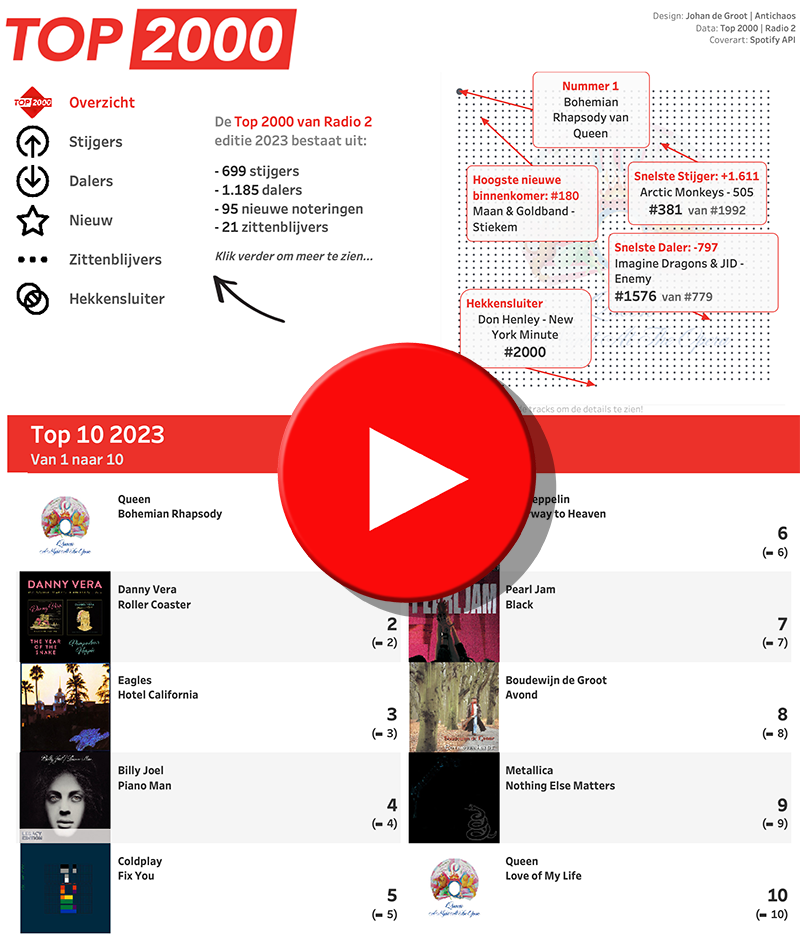
Top 2000 of 2023 – what stood out?
The Top 2000 of Radio 2 (a populair Dutch radio station) has been broadcast for the 25th time – and traditionally I am trying to turn this into a ‘different’ interactive data visualization…
Written by
-
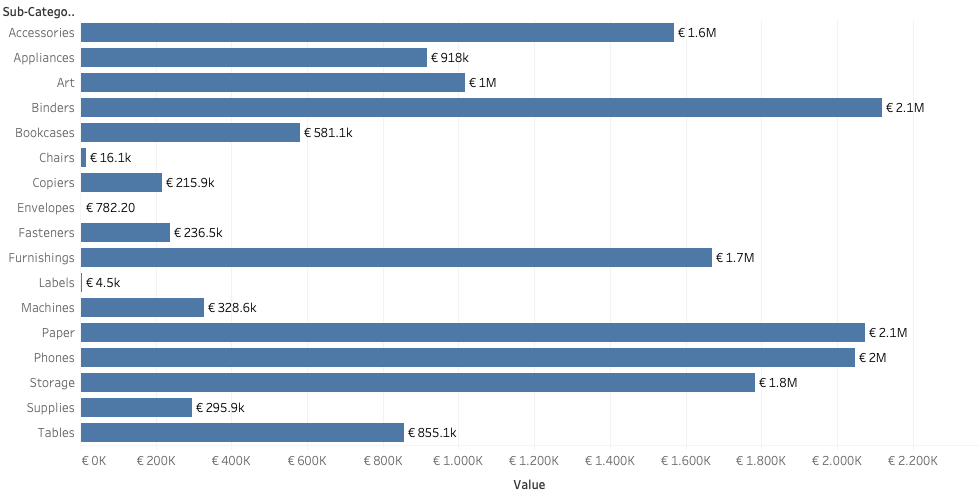
Dynamic value format – Better labels in Tableau
Labels are often an after-thought for many users – we don’t like them, but are necessary. Using some simple steps we can create better labels which are easier to interpret for the users of the dashboard. [This blogpost is part of a series tips tricks, as being presented at VizIt Berlin 2023]
Written by
-
Featured Forum Ambassador
Tableau has created a nice blog post on Tableau Forum Ambassadors. It describes what these ambassadors do, how they can be used on the Tableau journey,
Written by

-
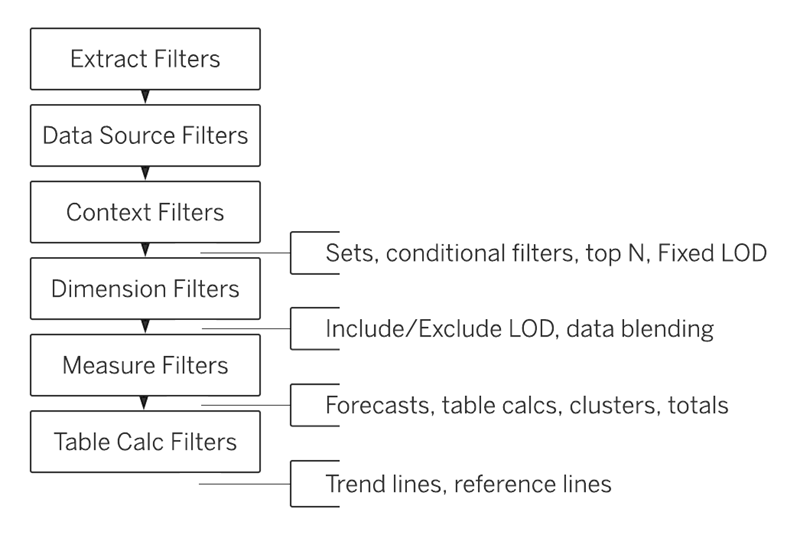
Tableau’s Order of Operations
The order of operations in Tableau refers to the sequence in which the software processes the data and calculations in a given worksheet or visualization. The order of operations in Tableau is the order in which Tableau performs its various actions. An action is mostly identified as a filter, but can also be a calculation…
Written by
-
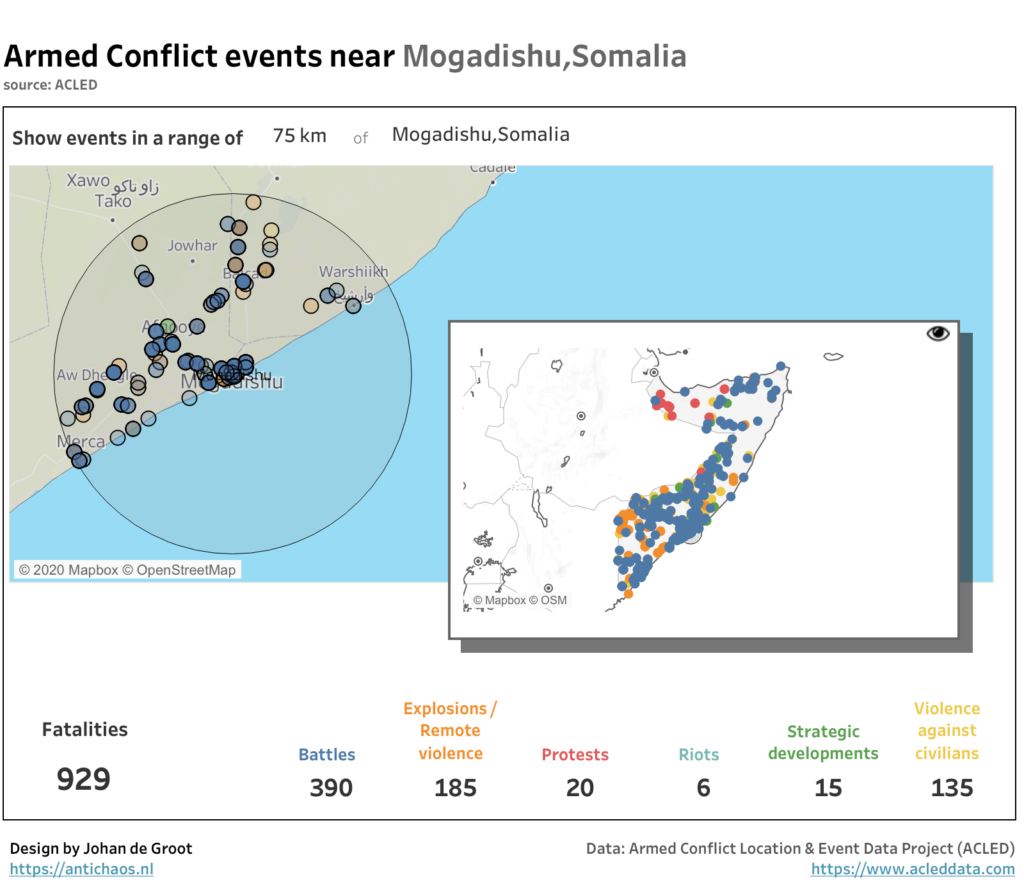
Map Layers in Tableau – step by step (or layer by layer)
The Tableau 2020.4 release comes fully-loaded with tons of great features, including several key updates to boost your geospatial analysis. In particular, the new multiple marks layers feature lets you add an unlimited number of layers to the map. This means you can visualize multiple sets of location data in context of one another, and…
Written by