Category: Datafam London 2024

  • Deep Cleaning: Icons

    Using the right visuals (images) on a dashboard is very important. Icons are often used go guide users into the right direction, so we don’t want to confuse them with unclear images

    [part of the ‘Datafam London 2024 – Deepcleaning your dashboard’ series]

    (more…)
  • Deep Cleaning Barcharts – part 2: Punctuated Bar Chart

    [part of the ‘Datafam London 2024 series]

    In part 1 we took a look at a basic bar chart, and ended with the lollypop chart. A fun chart with one major issue: the dot obfuscates the real datapoint.

    Punctuated Bar Chart

    One solution for it the Punctuated Bar Chart:
    We highlight the end of each bar, instead of enlarging the endpoint.

    (more…)
  • Deep Cleaning Barcharts – part 1: the basics

    [part of the ‘Datafam London 2024 series]

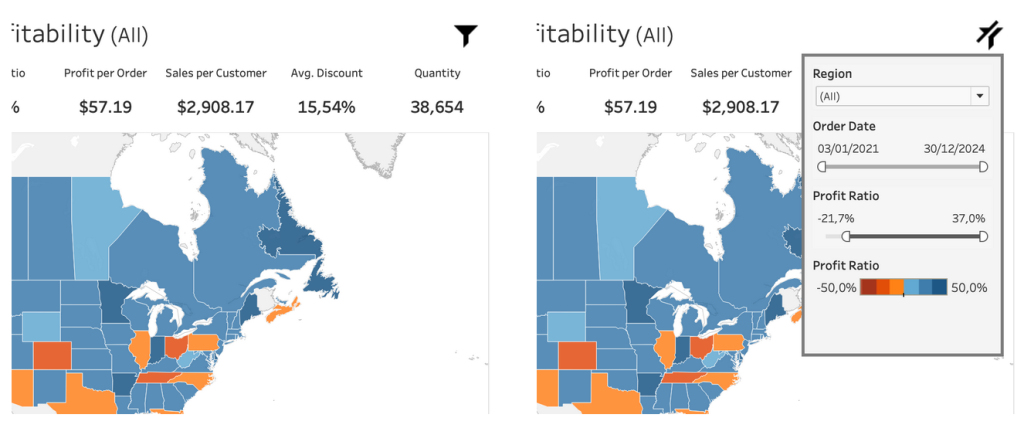
    On DataFam 2024 in London I gave a presentation / workshop on deep cleaning dashboards.

    Why cleaning dashboards?

    • Make it look better ▶ Users want to use it
    • Less clutter on your dashboard ▶ Less clutter in your brain
    • Making your dashboard more actionable ▶ Focusing on what’s important.

    Dashboard cleaning is about: Removing, adding , re-arranging, and replacing stuff. In Tableau, it’s about: Table calculations, extra sheets, changing images, talking to users, being critical to yourself, … Is hard work – and a lot of fun!

    (more…)
  • DataFam 2024 – London

    DataFam 2024 – London

    On the 11th and 12th of November of this year a complete new Tableau event was held in the center of London: DataFam 2024.

    Tableau Datafam 2024 London
    (more…)